The LCD panel market is the kind of market that gives classical economics a good name. When supply is stronger than demand, prices dive and when demand is stronger than supply, prices rise. This behaviour has been clear since the beginning of the TFT LCD market.

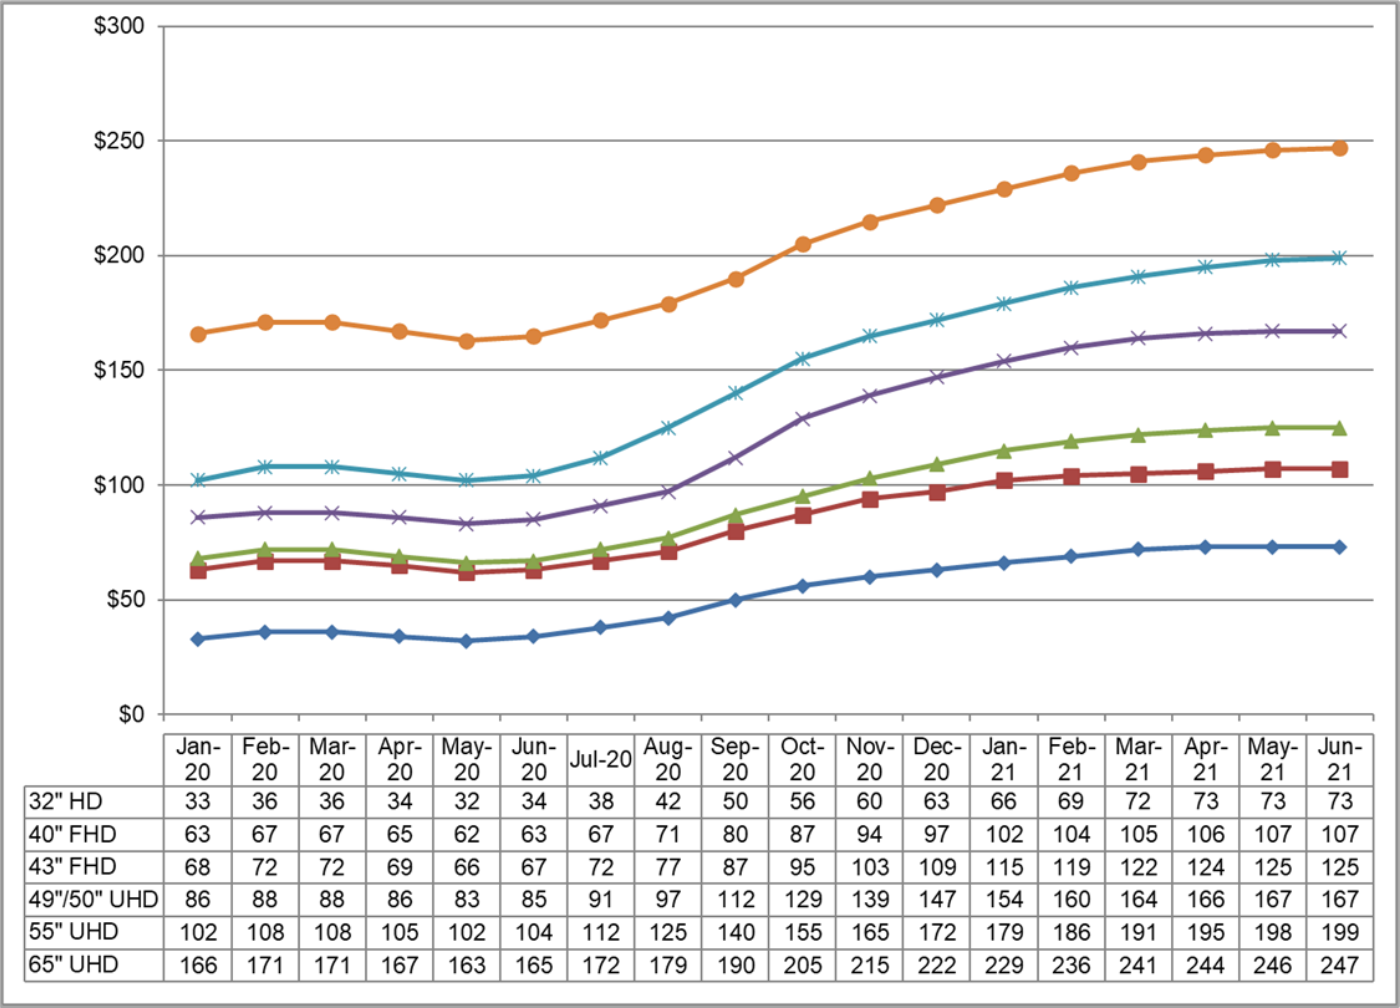
Given where we are now, with 55″ TV panel prices (without the backlights) getting down to almost $100 in 2020, it’s hard to remember that in the early days of TFT LCDs, because they enabled really usable notebook PCs for the first time, 10.4″ VGA (that’s 640 x 480 resolution) panels cost around $2,500. They were very hard to make in any volume with good quality, and the fabs needed to make them cost a lot. For a long time, the industry had a target of $100 per inch of diagonal. Last year, it was not far off $2 per diagonal inch!
Crystal Cycles
The industry has been multiple cycles, known as the ‘Crystal Cycle’. Everybody in the industry understands it and so you might hope that the industry had worked out a way of avoiding the peaks and troughs. (I won’t be nasty to any analysts that have suggested that we might be getting to the end of it – many have over the years!). I was slightly surprised on checking my database that I hadn’t used the phrase ‘LCD farmers’ for nearly three years, so it’s probably time I dusted it off. Why can’t the LCD makers stop the cycle?
 I won’t identify the very senior executive from a big display company that forecast the end of the Crystal Cycle at the SID Business Conference in 2005!
One reason is that they are like farmers, who also have problems with matching supply and demand. For hundreds of years, if the price of beef rises, more farmers keep cattle. That means more beef and the increased supply drives down the price of beef, so the farmers grumble and get rid of their cattle as they can’t make a profit. So, supply drops and prices rise again. So the farmers get more cattle…..
The Beer Game
Also, looking back, I see that I haven’t mentioned ‘the Beer Game’ for 10 years or so. One of the problems for any multi-level business (such as TV sets which need glass and other materials supplied to panel makers, who sell to set makers, who sell to brands, who sell to wholesalers who sell to retailers, who sell to users) is that a) you don’t always know what is going on ‘further up the supply chain’ and b) even if you do know, those in the different layers will be trying to optimise their positions to maximise their own profits at at the expense of others.
The Beer Game was invented back in the 1960s at MIT and is a simulation of this kind of multi-company supply chain. The aim of the game is to show that the system can be optimised if (and only if) there is good communication between the different parts of the chain. Of course, companies understand this and try to do their best to get good information about what is happening at each stage. Companies such as NPD and GfK have very good businesses selling information about what is happening in TV retail to companies in the TV supply chain so that they can see where there is over- or under-supply and to see, as soon as possible, any trends that might change the supply/demand balance.
Supply/Demand/Inventory & Pricing
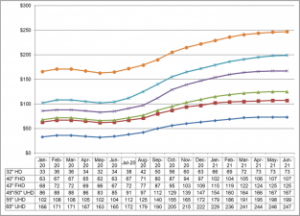
For several years, when monitors were the biggest application for LCDs and Europe was the biggest market for those monitors, as a specialist in the European monitor market, I was able to forecast panel pricing trends with a level of accuracy that surprised some.
I would know that we were heading for a problem when the forecasts for volumes from the panel makers multiplied by the price of panels that they expected meant a too rapid increase in the amount of revenues that would come back to them. I knew that buyers tended to have fairly steady and fixed budgets so when the numbers didn’t add up, I could forecast when the panel makers would have to cut their prices to meet their volume targets. (I’ll return to that)
It was useful to know that prices would need to drop, but the real killer was to know when that would happen, so I started to collect very approximate inventory data from brands of monitors in Europe every month. By watching when that started to ramp up, I would know that pricing was too high. I knew that the brands would reduce their orders on the set factories and that would mean that the set makers, in turn, would cut their orders to the panel makers. At that point, the panel makers would reduce their prices.
I got pretty good at that and made myself a friend of a number of brands that trusted my information and cut their inventory in advance and were able to re-stock at, often, much lower prices. A customer once said to me “I would give you a PO that said ‘some years Bob tells us something really, really useful'”. I often found, however, that brands and panel makers thought they knew best and that an analyst sitting in an office in the UK couldn’t possibly know what was going to happen in a huge Asian industry!
Understanding the Supply & Demand
The key was understanding both the supply and demand. As the monitor industry moved from CRTs to LCD, there was a period when supply/demand pricing (or as the economists would put it, the “Price elasticity of demand“) was absolutely classic. When the price of LCDs dropped, buyers switched from CRTS. As soon as the prices for LCDs rose, they switched back to CRTs. For the panel makers, it was like having a simple volume control on demand.
I was at a meeting of monitor makers in Germany that I had organised to discuss issues related to the duty levels being charged on import to Europe. After the meeting, I was chatting to one of the brands and I said “One of these days, there won’t be any more CRT buyers left any more. Doh! That’s today!!” As it happened, I was due to give a talk at the US FPD event run by Ross Young when he was at DisplaySearch (an event that I really miss, these days!). In the talk, I pointed out that the LCD makers had now replaced the CRTs, so if panel makers continued to reduce pricing (there had been signs of over-supply at that time), they would cut their revenue, but wouldn’t drive additional volume. Sadly, they didn’t listen, continued to slash prices and didn’t drive additional volume. It was frustrating to know that they were throwing away hundreds of millions of dollars in revenue, when they wouldn’t spend a few thousand on my market intelligence!!
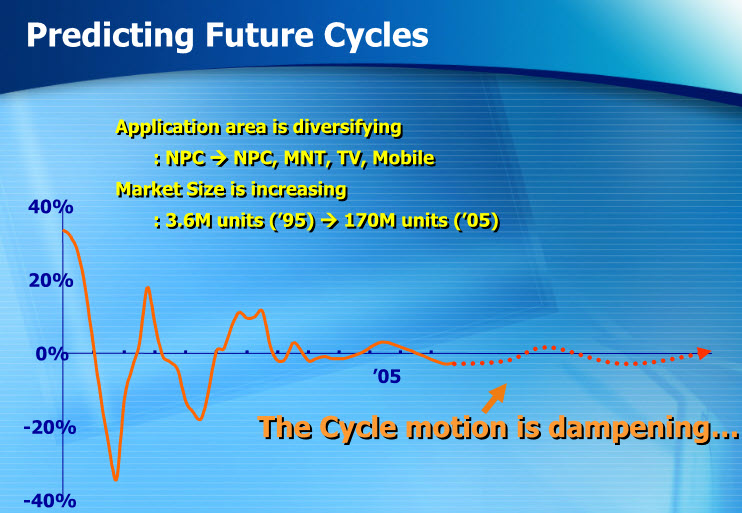
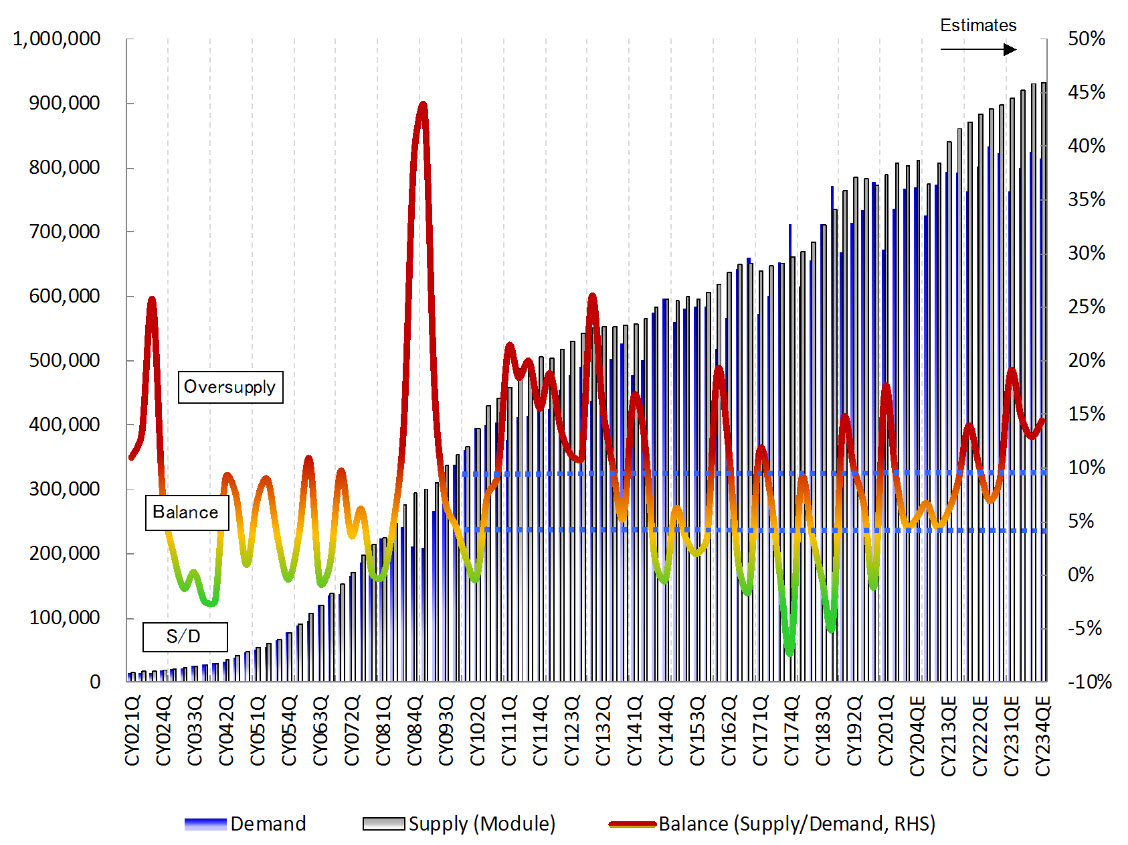 Nakane-san of Mizhuo presented this historical view of the Crystal Cycles in LCD at the SID Business Conference. Over-supply of 5%-10% are generally felt to be ‘balance’.
Panel Makers Learn Some Lessons
In later crystal cycles, the panel makers got a bit cleverer about how they responded and in recent years, they have done their best to stabilise pricing by reducing how many panels they make, their ‘fab utilisation’. That squeezes supply a bit and helps to keep prices firmer. However, it’s hard to ‘sit on your hands’ like this.
Why didn’t they simply reduce production earlier to avoid excess supply? Basically it’s because for a long time there was a continuous arrival of new fabs. Any fab is unprofitable when it’s new because the yield tends to be poor (i.e. the proportion of the panels made that are of saleable quality). The way to improve yield is to make more panels. Unless you make panels, you can’t improve the yield. Further, the fabs were getting better and better every couple of years, so if you mothballed a fab, it would get overtaken. So, once you have a new fab, you have to drive volume as quickly as you can.
That dynamic was critical to the cycle. If the market size was effectively fixed and the supply was also fixed, the only real variable was price.
Timing
Anyway, a key factor in the development of the kind of cycle that we see in the LCD market is the time lag. Like the farmers, LCD makers cannot respond quickly in changing the level of supply. It takes time to build and ramp new fabs. It also takes time to stop or delay investment plans. Further, public companies with independent finance (e.g. LG Displays, AUO) have to raise money when they are doing well but if they spend it at that point in the cycle, they know that the investment, by the time it creates new supply, will come into the market when it is not really needed. I talked about this in a Display Daily last year (Another of Those Damned Inflection Points….).
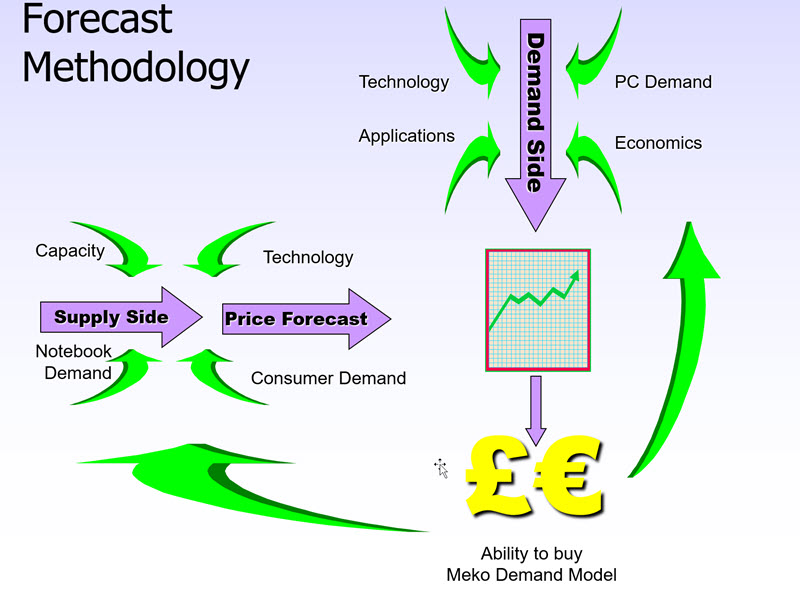
All of these factors are compounded by the fact that while hard work, good contacts and industry understanding are probably enough to understand the supply side of the market fairly accurately, nobody knows the demand side in the future. Analysts and forecasters can point out the likely demand, but natural disasters, politics and even fashions can interrupt any careful economic analysis. The best forecast is a range of scenarios, but executives tend to like single figures.
Hmm…. This Display Daily has been a bit longer than I planned! My main topic was going to be the current surge in TV LCD pricing highlighted by recent data from DSCC. You can check here for their blog on current conditions.
The rising prices for panels will be squeezing the margins of TV set makers. We have already seen that Samsung has put up its 2021 prices, compared to 2020 and that trend may continue, although some brands may sacrifice profit to try to grow their share. Higher prices of sets may dampen demand a bit. As Paul Gray of Omdia used to say (if I remember correctly!) “When your TV breaks, you don’t take up reading”. However, if set prices are a bit higher, you may settle for a smaller set than you would have done. That reduces the area of LCD that is needed and will lead to a correction in demand, bringing more balance.
At the same time, the improved revenues help to finance more investment and DSCC posted another blog on that topic here.
And so we go around the cycle again!