This topic of discussion started as an email thread in the HDR work group of the International Committee of Display Metrology (ICDM) and then sparked a long discussion in the recent face-to-face meeting in Mt. View, California. Per agreement with ICDM, they agreed to allow me to write this artcile.

Many in the group believed that since the Perceptual Quantizer (PQ) curve is a display-referred Electro-Optic Transfer Function (EOTF) the answer is yes – one should follow the PQ curve as well as possible. It turns out the answer is a more nebulous: it depends.
For example, if you are using a reference monitor for content color grading, then you want to follow the PQ curve. For a consumer display, it may or may not follow the PQ curve. It depends on the philosophy and sophistication of the display company, it would seem. Therefore, measuring the ability of the display to follow the PQ is a good thing for reference monitors, but may not be a useful metric for consumer displays.
What is the PQ Curve?
The Perceptual Quantizer curve was developed and approved by SMPTE (ST-2084). As a display-referred EOTF, that means a specific code value in the content is supposed to produce a specific luminance level on the display.
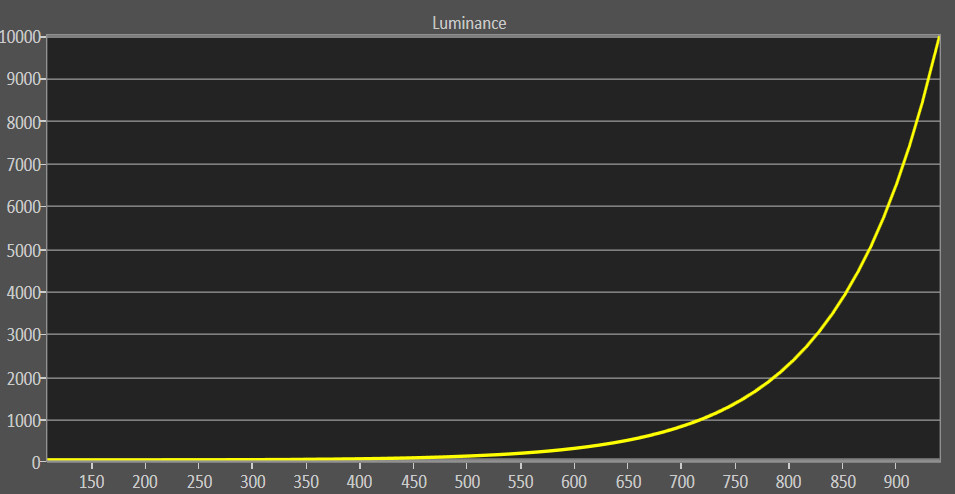
The PQ curve does not have a linear relationship between code values and light intensity. That is because quantization for our eyes would not be efficient. We do not sense light linearly – humans are more sensitive to subtle light changes in dimmer light than bright light. The figure below shows the relationship between code values and luminance for the PQ EOTF. Note the around 75% of the code values are devoted to the less than 1,000 cd/m² level.
Many HDR capturing sources such as cameras with RAW recorders can acquire data over the full luminance range of PQ: from 0.0001 cd/m² to 10,000 cd/m². However, no commercially available displays can produce luminance over this range. As a result, some processing of content data must be done to output on the display. This process is called color grading and compresses the full range of luminance and color values to that of the mastering display. Further compression may result when this content is delivered to a display whose range of colors and luminance is less than the mastering monitor.
The one exception to this rule we have seen was demonstrated recently at CES 2018. Sony showed an HDR display that was capable of producing 10,000 cd/m² in a very small area. In this case, no compression of the PQ-encoded data was needed as the display was capable of matching what the content called for.
Tone Mapping Options
When the capability of the display does not match the performance of the mastering monitor, some tone mapping is needed.
For a mastering monitor, pixels that have luminance values above the peak value of the display are “clipped” to the peak luminance of the display. For example, if a scene has some bright clouds with captured luminance ranges that vary above 1000 cd/m², these all get clipped to the 1000 cd/m² level, thus losing that subtle detail in the display. Exactly how this is done is a creative decision during color grading and can be called creative intent and these subtle highlights are lost (although in some cases values above the clipping point remain in the content).
Using consumer displays, one can apply tone mapping and gamut mapping. Tone mapping is needed when the consumer display has a reduced luminance range compared to the mastering display. Tone mapping remaps luminance from the source values to the lower values the display can support. Gamut mapping refers to the remapping of color values that exceed the capabilities of the display to the native gamut of the display. These two processes are tied together and are sometimes referred to simply as tone mapping or color volume remapping.
Reference Monitors
Reference monitors are used to grade the content for distribution. These are supposed to be highly accurate monitors but they are not capable of displaying the full range of luminance in the PQ standard, nor the full range of colors in the BT.2020 color gamut. Today, there are two practical reference monitors at 1000 and 4000 cd/m² with each supporting the DCI-P3 color gamut, which is smaller than the BT.2020 color gamut. In the world of HDR for consumers, BT.2020 is mandatory. This does not mean that the display has to have 2020 primaries, but it should follow BT.2020 colorimetry.
So what does the mastering monitor do? For pixel luminance up to the capabilities of the display (1000 or 4000 cd/m²), these values follow the PQ curve and are displayed as accurately as possible. Ideally, red, green and blue components also follow the PQ curve so that their combination, a gray level, also follows the PQ curve.
For pixel values above the peak luminance of the display, a reference monitor should “clip” those values back to the maximum capabilities of the display. Tone mapping changes the luminance of the pixel to the maximum value of the display, but not the chromaticity of the pixel. Such a change just in luminance may change our perception of the pixel (a bright yellow pixel looks yellow but a dim yellow pixel looks brown).
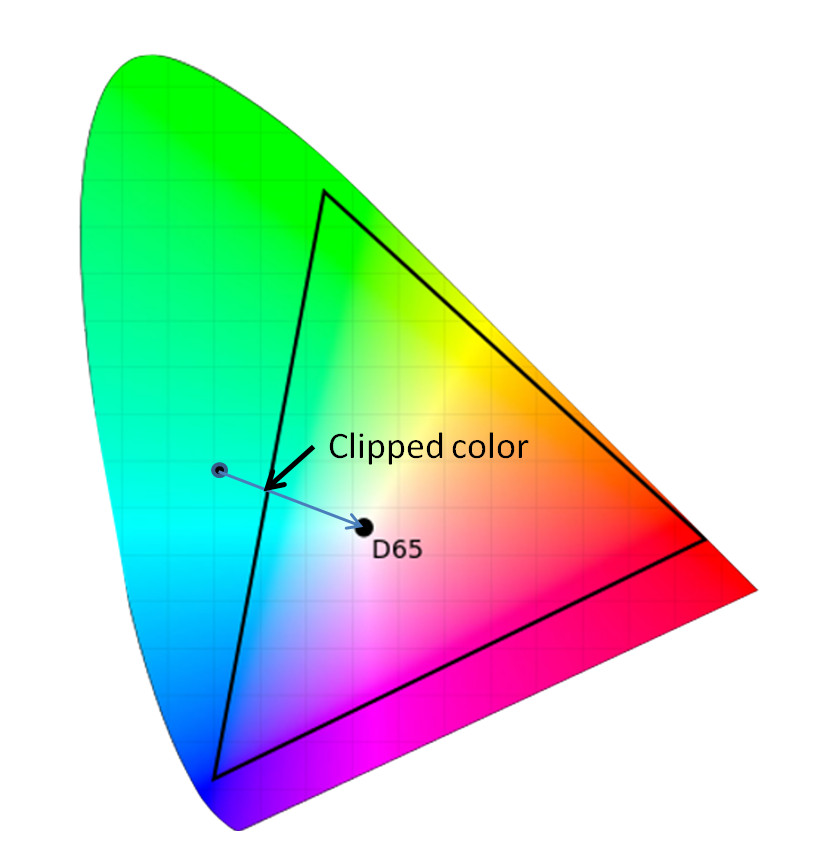
Clipping can also mean adjusting the chromaticity of the pixel. For chromaticity points outside of the native color gamut (P3 in this case), clipping generally means extending a line from the chromaticity point back to the D65 white point and finding where it intersects the native gamut (see figure). Again, this may change our perception of this color (less saturated or a hue shift).
Mastering displays operate this way because they define the original intention of the content. Tone mapping and gamut remapping need to take place in any display showing the content with compromised specs compared to the mastering display.
From a metrology point of view, it is very desirable to measure the red, green, blue light output vs. code value to see how accurately it follows the PQ curve up to the point of maximum luminance of the display. Any code values above the nominal peak level of the content should all map to the same maximum luminance level.
Consumer Displays
Consumer displays playing back HDR content offer a wide range of luminance levels and color gamut coverage. Some have capabilities that are similar to the 1000 cd/m², P3 gamut reference monitor while others fall below this capability. Such consumer displays don’t usually clip, but employ tone mapping and gamut mapping to create as pleasing a picture as possible.
Conventional wisdom has been that you follow the PQ curve up to a certain luminance level and then start to apply tone mapping and gamut mapping. But at the ICDM meeting, Florian Friedrich of FF Pictures led the discussion to provide more clarity into this thinking.
According to Friedrich, conventional wisdom would say that you follow the PQ curve to perhaps 500 cd/m², then remap code values from 500 to 1000 cd/m² (for content mastered at 1000 cd/m²) to the 500-700 cd/m² range using a smooth rollover curve for TVs with a peak luminance capability of 700 nits.
This is a form of compression. For example, if adjacent pixels varied by five code values in the content, they might be compressed to a difference of two code values for display. The difference is still there, but is not perceivable by the eye. If the delivered content was mastered at 4000 cd/m², the compression is even higher.
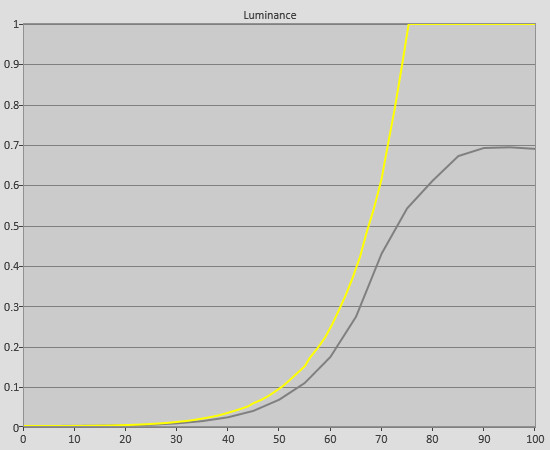
Apparently, some TVs make a different choice to follow the shape of the PQ curve in the lower luminance ranges, but at lower luminance levels. For example, if code value xx calls for 100 cd/m² on the display, they will display around 90 cd/m² (see figure).
Tone and gamut mapping is still needed to map higher luminance values to the capabilities of the display, but this is done in a way to preserve creative intent. For example, tone and gamut mapping may be done to try to preserve the brightness of the pixel but may introduce color shifts that make detection of subtle shades hard to see. Alternatively, tone and gamut mapping can work to preserve these subtle gradations by maintaining hue subtleties in the remapping process, but may sacrifice the overall luminance a bit.
Dynamic metadata allows the HDR display to change its tone and gamut mapping on a scene-by-scene or frame-by-frame basis. Samsung’s new HDR10+ scheme provides metadata to optimize the picture quality of the HDR display – particularly when the display has luminance below 1000 cd/m² and/or color performance less than DCI-P3.
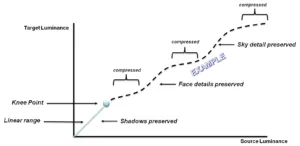
Below is a graphic showing an example of a modified EOTF for a particular scene. In the “linear range”, the display follows the PQ curve up to the knee point (some luminance level). Above that, compression is applied but it may not be a simple roll off type curve. Instead, it may take a more complex shape that is better at preserving face or sky details, for example. In these ranges, the display may return to following the PQ curve.
From a metrology point of view, one can measure how well the consumer display follows the PQ curve, but reporting a high deviation may be misleading. For example, users will assume that a large deviation is not good, when in fact such deviations may have been done intentionally to offer a better picture for the consumer.
In the opinion of Friedrich, an ideal display should follow the PQ curve as accurately as possible. Displays with significant compromises in peak brightness or dynamic range shall apply tone mapping, where a pleasing image is more important than following the PQ curve.
After the meeting, Friedrich did some experiments using a tone mapping pattern he developed. After optimizing the HDR performance of front-projection systems under different conditions he came to the conclusion that the important logarithmic steps in the PQ signal (1000, 100, 10, 1, 0.1, 0.01) should be maintained with decent contrast and differentiation. If a system can’t maintain those factors of 10 well, then limitations in these factors are more pleasing than following the PQ curve accurately. “A minimum factor of four within the available dynamic range of the display is what I found out should be maintained for a pleasing image with decent contrast,” he said. In other words, the differentiation in between black, shadows, mid tones and highlights should be preserved with decent contrast and differentiation in between these steps. Friedrich has also developed some Plug-Ins for color grading and editing systems such as Davinci Resolve and Adobe Premiere in order to help content creators deal with soft clipping of blacks and highlights, metrics in HDR signals and conversions in between different SDR and HDR versions. – CC
Note that the first version of this article referred to individuals within the ICDM who asked for references to them to be removed, which we have done to ensure their comfort with the ICDM process. (BR)