UDC reported Q419 and 2019 results last week. For the quarter, red and green material revenues were $60.5m up 52.4% Y/Y and total material revenues, including royalties were $98.5m up 46.2% Y/Y. For the full year, red and green material revenues were $242.7m, up 34.5% and total material revenues were $392.9m up 48.0% Y/Y

Figure 1: Q419 UDC Material Revenue and Growth
 Source: UDC Company Financial Reports
UDC revenue is closely aligned to the shipments of OLED panels and the changes in material revenue would normally be expected to parallel OLED substrate starts as measured in sq. m of glass to take into consideration yields and utilization. However, unlike the panel shipments, material revenue has variants beyond pure substrates starts (measured in sq. m):
- The price per gram is subject to volume discounts, such that average price of 1m² of material might change from quarter to quarter depending on the usage. The maximum material price is 2X the minimum. In addition, the volume discount resets with each new material configuration.
- Panel makers use a JIT approach and generally try to keep a minimum of inventory, but if they miss on shipment forecasts as was the case in Q118 and Q119, when iPhone volume was significantly less than expected, an inventory build-up occurs that was used in Q3 and Q4, causing a mismatch between shipments and material revenue.
- Panel makers are always trying to minimize material costs and generally try to reduce the layer thickness. The application of the new thickness coincides with the incorporation of a new material configuration
- Panel makers also try to recover wasted material and have varied success levels. Typically, it is 10% to 15% of material deposited on the walls of the tool or on the FMM.
In the past, these factors have contributed to a mismatch in UDC material revenue and area shipments as shown in the next chart.
Figure 2: UDC Material Revenue vs. Substrate Starts in Glass (sq. m)
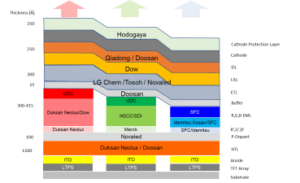
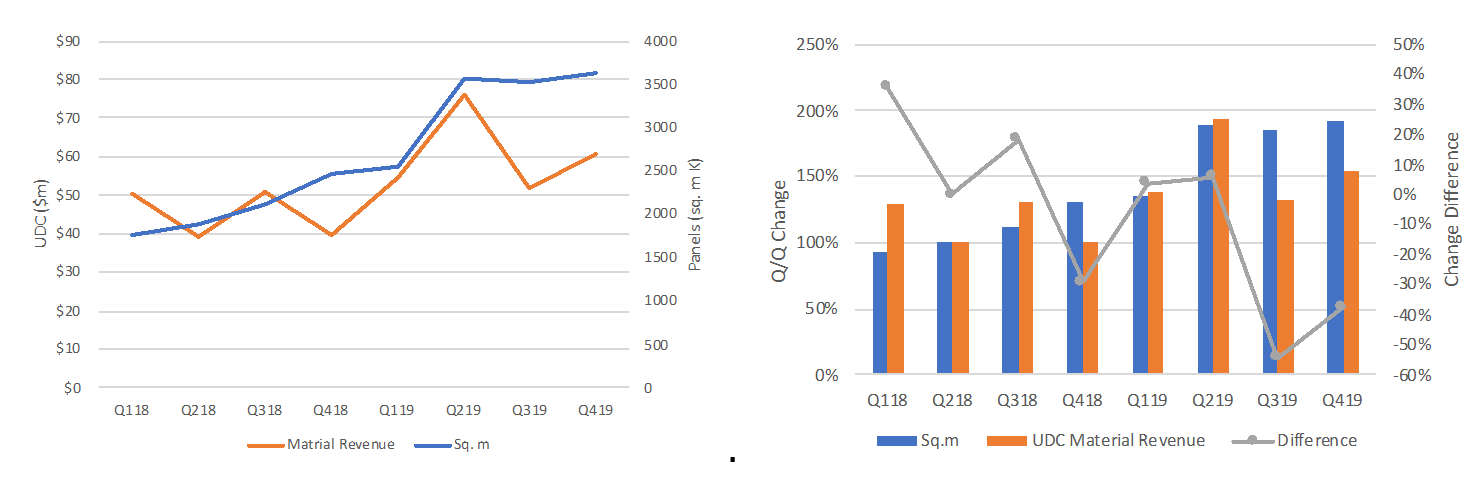 Source: UDC Company Financial ReportsThe OLED Association cooperates with DSCC on a quarterly report calculating the material consumption and revenue of all organic material used to produce active matrix and passive matrix OLED displays and lighting. The report shows the stack and material thickness (layers) of every OLED manufacturer and the material revenue is calculated using quotes from a number of sources on the price per gram of each material layer. An example of the stack for Samsung FMM process is shown in the next chart.
Figure 3: OLED Panel Stack for Smartphones Using FMM
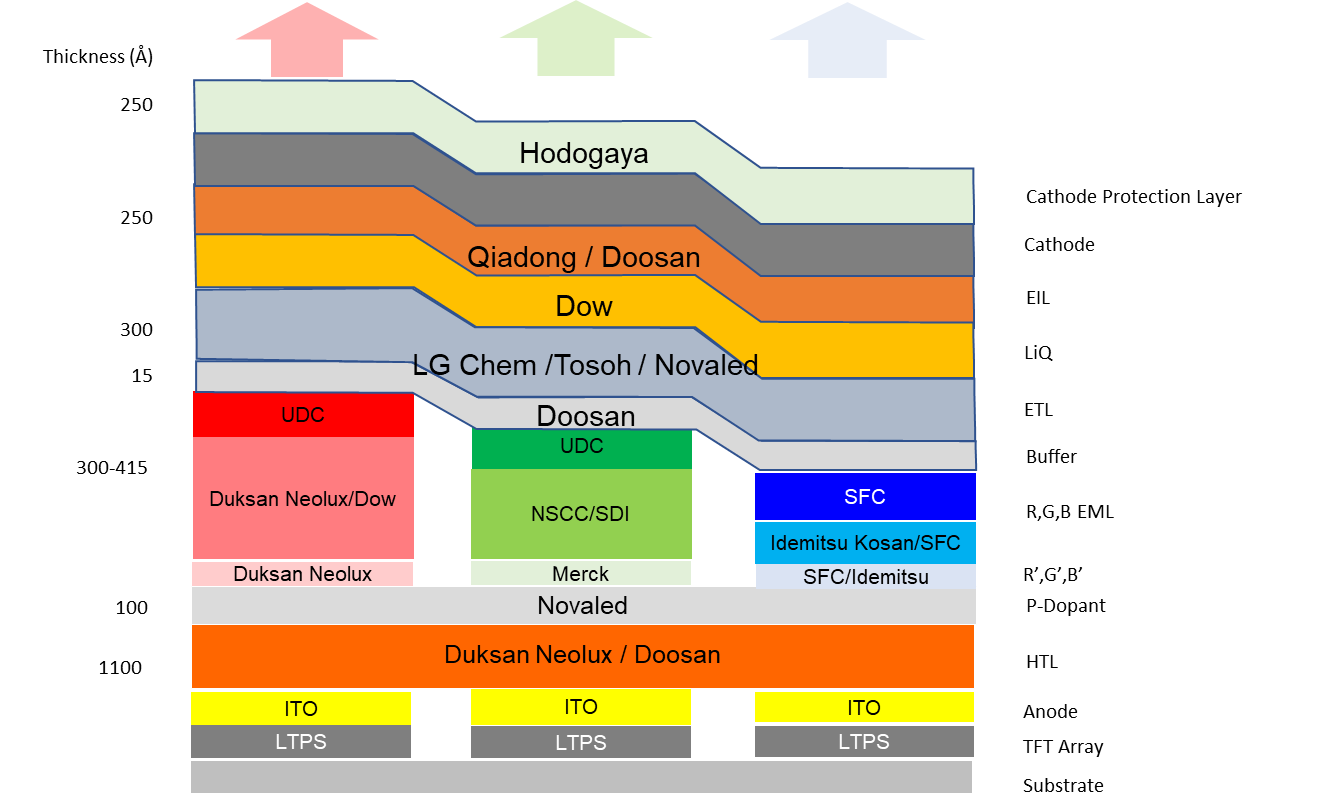
Source: DSCC
Using the layer thickness, area shipments and the average price/gram, the revenues are calculated.
Figure 4: UDC Revenue vs. Calculated Revenue (Model) by Material
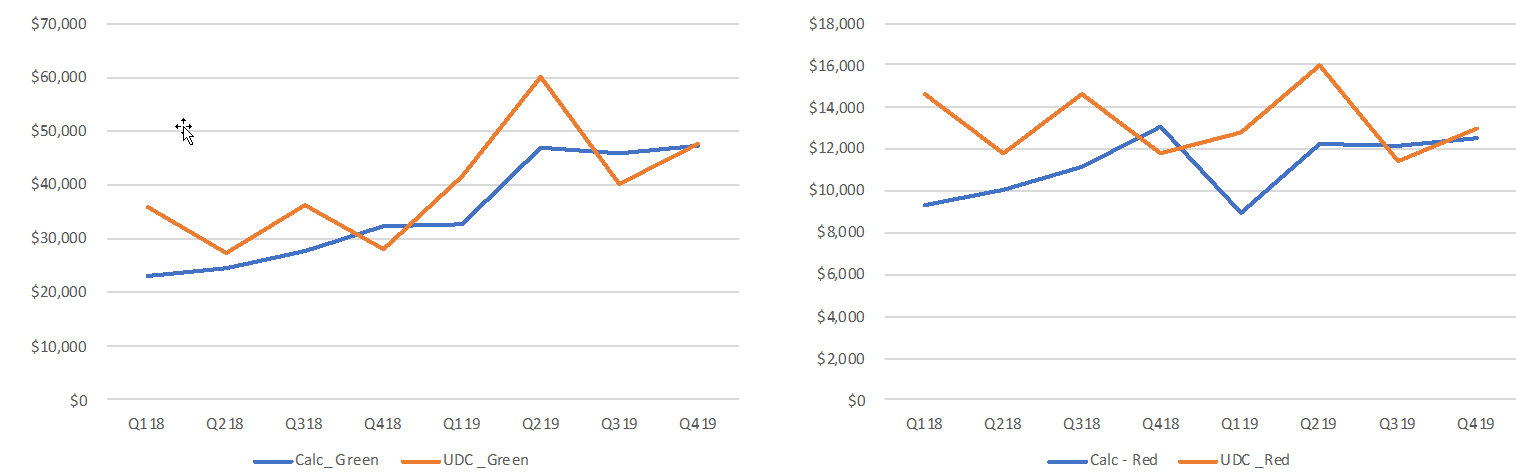 Source: UDC Company Financial Reports, DSCC, OLED-A
As anticipated the differences in revenue are relatively consistent with the chart comparing UDC revenues and area shipments. For both red and green, the plots diverge in Q1 and tend to merge. However, under ASC 606, which is GAAP accounting and was recently adopted by UDC, material revenues are based on an average selling price, which is what the DSCC model uses, so the prior swings due to product mix are less of an issue as demonstrated by the alignment of Q3 and Q4 revenues in the previous charts.
For 2020, DSCC forecasts mobile, TV and Other OLED panel in terms of panel revenue and sq. m, based on substrate starts.
Figure 5: Forecasted Substrate Starts Measured in Area (sq. m) by Application
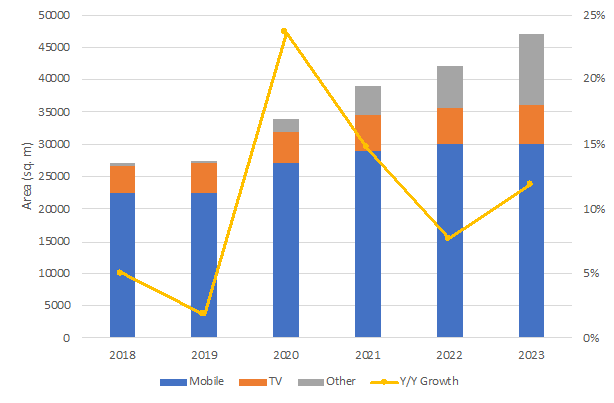 Source: DSCC
In Q120, the smartphone markets are expected to be affected by the COVID-19 virus:
- Demand in China, is expected to be 77 million smartphones down 20% Y/Y from 96.8 million
- Smartphone production for Huawei, Oppo, Vivo and Xiaomi is forecast to be down 20% to 30%. Apple’s production performed in China is also expected to be down 10% Y/Y to 35m.
- Samsung’s volume is expected to hold to the current forecast.
- LG’s TV shipments in Q419 were 1 million and were largely from the Gen 8.5 fabs in Paju. The volume is expected to remain the same in Q120.
- Other panels, mostly, smartwatch panels are produced in Korea and are expected to remain as forecast.
The net impact of the COVID-19 virus is therefore a drop of 20 million smartphones vs. the forecast in Q120, which shouldn’t materially impact UDC’s revenue, given a base of 120 to 130 million OLED smartphone panels forecasted prior to the virus.
For the year, we expect OLED panel shipments by application:
- Smartphones – 590 million
- TVs –5.9 million
- Other – 57 million
If the COVID-19 in China continues to recede, the 2020 impact on UDC should be minor, although there may be some inventory build-up in the 1st quarter as production will be down and it could take 2-3 quarters to recover.
Looking beyond 2020, UDC should continue to grow in parallel with the OLED industry with the following variances:
- Samsung, and CSoT will be entering the TV market but they will not use UDC material so any shipments by these companies will not result in UDC revenue. Samsung will use a combination of blue OLED material and Quantum Dots. CSoT is expected to use polymer material and Ink Jet Printing (IJP) to produce OLED TV panels. BOE is considering alternative manufacturing techniques including WRGB and IJP, but have not yet decided.
- Should these approaches prove able to produce panels that have competitive performance and are less costly than the LG WOLED approach, it would put pressure on LG to use IJP in its upcoming Gen 10.5 fab due after 2022.
- In 2020, JOLED is installing a Gen 5.5 OLED fab with 20,000 substrates/mo. that uses polymer material and IJP
- TADF material has been under development by Cynora and Kyulux for years and both companies after trying to produce blue are now concentrating on red and green. Early reports from panel makers indicate that the red TADF may be just as costly as the phosphorescent version and not as efficient. The status of the green material is still untested. We did not include the replacement of phosphorescent with TADF material in our forecasts. (Editor’s note – we got this article just before Cynora announced its blue material Cynora Introduces Fluorescent Blue Emitter That Gives OLED Devices Substantial Efficiency Boost)
- UDC is making progress on a new deposition tool for large area panels, which would enable the use of pixelated RGB using phosphorescent red and green, but it is still in the R&D stage and unlikely to affect the forecast period
- Should UDC produce a blue phosphorescent commercial variant, it would increase their revenue by almost 1/3, but they have been working on it for >10 years and their only comment is “We are making progress”. Revenue from blue is not included in the forecast.
- UDC has been very aggressive in their material development producing new molecules on an annual basis that increase the performance of the displays. The benefits to the panel makers are obvious and for UDC it protects them from competitors copying the older versions. It also resets the clock on the volume discounts. We assumed that UDC would continue the practice, but after 20 years, they may be reaching the point where the benefits of changing do not outweigh the cost. In addition, the license agreements with Samsung, LG and others expire in 2022.
Figure 6: Forecasted UDC Royalties, Red and Green Revenue
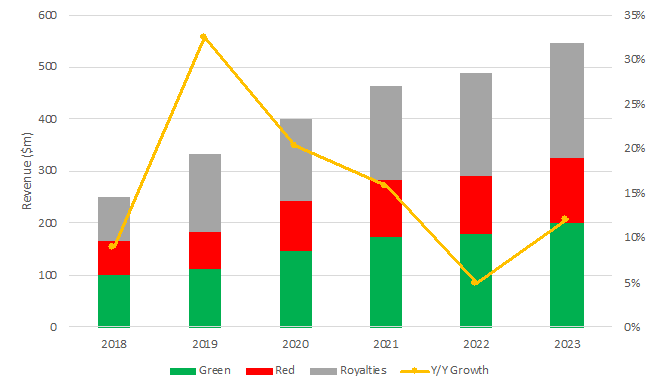 Source: UDC Company Financial Reports
The next figure compares the forecasted growth in shipments and area with our calculation of UDC revenue for 2019 thru 2023. It shows a CAGR of 28% for revenue and 29% for area vs. 13% for UDC revenue. The slower growth for UDC is primarily a function of not keeping up with the OLED TV panel production.
Figure 7: Forecasted Shipments and Area Growth vs. Modeled UDC Revenue Growth
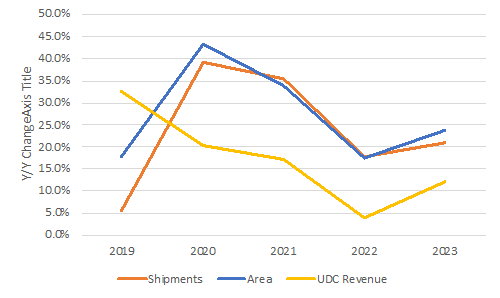 Source: UDC Company Financial Reports, DSCC
UDC often cites OLED lighting as future source growth path, however, the volume is so low that it does not have a material impact on total revenue. It is unlikely that it will impact the future as the few OLED lighting fabs are Gen 2.5 and smaller. The one opportunity for growth was the Gen 5 OLED lighting fab that LG started but has since shuttered and at this point there are no known plans for constructing larger fabs.
References to DSCC can all be found in the their Quarterly OLED Material Report – Barry Young
Barry Young is the Chairman and CEO of the OLED Association