We have updated DSCC’s Quarterly OLED Supply/Demand and Capital Spending Report for Q2, with DSCC’s latest capacity outlook for the industry and our forecast for OLED panel demand. As we have reported for more than a year now, OLED for smartphones (technically, for Small & Medium applications) continues to have a substantial oversupply which is expected to persist for years.
We have revised our outlook for OLED TVs on both the supply and demand sides, and we now expect a modest oversupply in 2020 with lower utilization, but resuming in 2021 we expect high utilization at OLED TV fabs.
The oversupply results from Samsung’s enduring near-monopoly on flexible OLED phone panels, combined with the continuing investment by BOE and other Chinese panel makers in flexible OLED capacity. Because these panels are so challenging to make, all of Samsung’s competitors are struggling with low yields, so despite aggressive expansion plans they cannot make enough panels to affect flexible OLED panel pricing. Samsung chooses to keep flexible OLED panel prices high, and suffer through low utilization rates but keep high profit margins, rather than drop prices to fill their factory.
The demand slowdown resulting from the COVID-19 pandemic and associated macroeconomic contraction has hit rigid OLED particularly hard, as we related last week in our article on fab utilization. As a result, the oversupply in rigid OLED has increased in 2020. With demand expected to recover by 2021, and with panel makers seeking to increase production of larger IT products, we expect rigid OLED supply/demand to improve.
DSCC’s OLED capacity outlook extends to 2025 and covers the capacity for 97 different phases of OLED capacity investments, over 13 different panel makers, and details the supply capacity of the industry by manufacturer, by country, by substrate type (flexible/rigid), deposition type, backplane type, color type and form factor.
The report includes two separate views of capacity, DSCC’s “aggressive” capacity case which includes all possible fabs, and our “conservative” case which includes only fabs in our A, B and C groups. Group C fabs have equipment POs issued more than year in the future, but are considered high probability (>>50%). The conservative case excludes D and E group fabs which are considered as less than 50% probable.
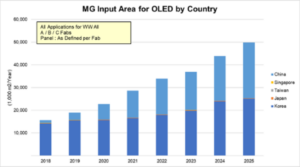
In both smartphones and TVs, OLED capacity today is dominated by Korean panel makers (Samsung and LGD, respectively), but capacity additions in China, including not only Chinese panel makers but LGD’s addition in Guangzhou, have increased China’s share of capacity from 5% in 2017 to 30% this year and expected to be 41% in 2021, but thereafter capacity additions in Korea will keep that country in the lead of capacity, but China continues to gain ground up to 49% in 2025.
In OLED TV, China’s share of capacity (overwhelmingly from LGD Guangzhou) will peak at 45% of worldwide capacity in 2021, before investments by Samsung in QD OLED bolster Korea’s leadership in capacity in 2022-2024, and China’s capacity share falls to 37% in 2024 before recovering with investments by BOE and CSOT to reach 45% in 2025.
OLED Input Area for All Applications, 2017-2025+
While LGD will continue to lead in OLED TV capacity throughout our forecast, capacity additions by Samsung, BOE, and CSOT will reduce LGDs share of capacity from 100% in 2020 to 55% in 2025, as Samsung grows to 23% of industry capacity.
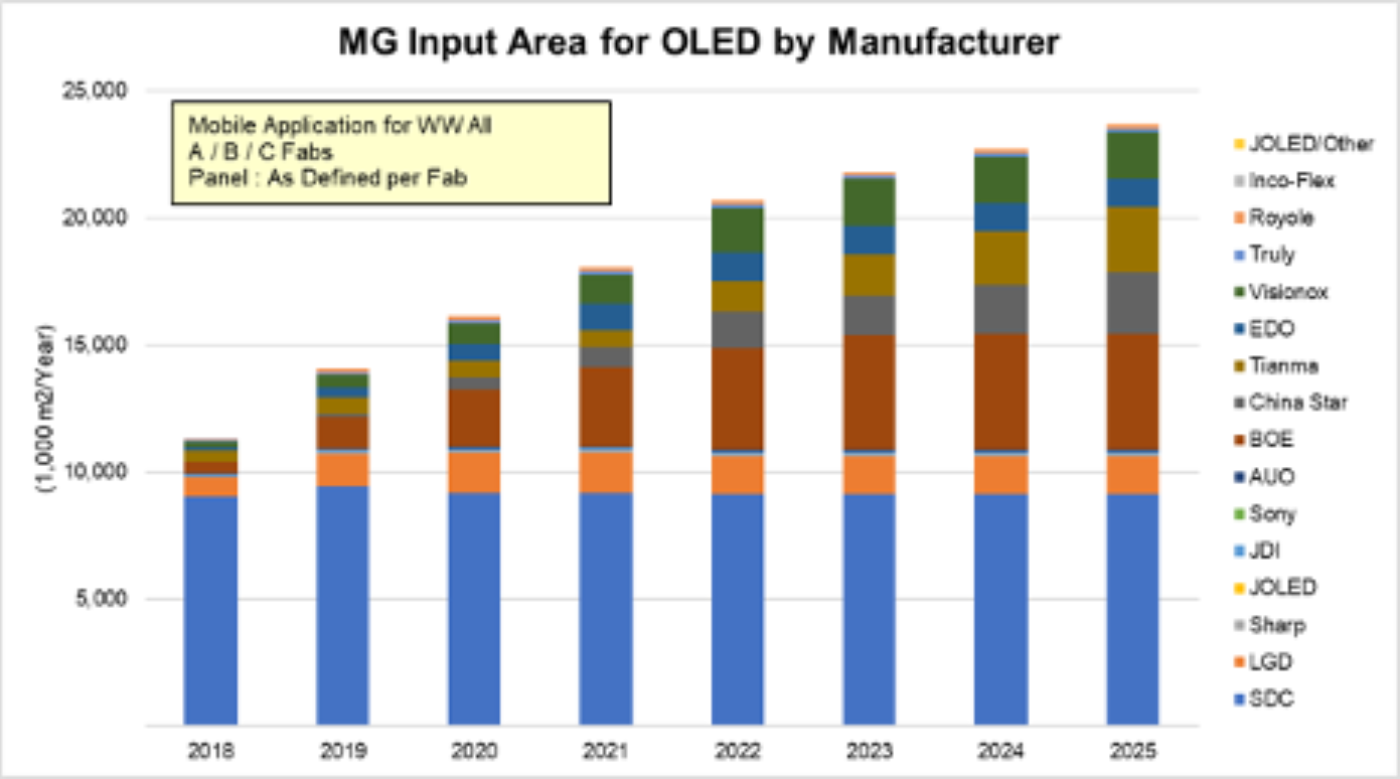
In Small/Medium OLED, Samsung’s share of capacity will continue its steady decline as their capacity sees modest reductions in 2020-2023 associated with the introduction of Y-OCTA while Chinese panel makers aggressively add capacity. Samsung capacity share was from 88% in 2017, but has already dropped to 57% in 2020 and will further decline to 39% in 2025. BOE has passed LGD to become the #2 supplier by capacity this year, and LGD will be passed by Visionox in 2022 and by CSOT and Tianma in 2023 to fall to the #6 position.
OLED Input Area for Small/Medium Applications by Manufacturer, 2017-2025
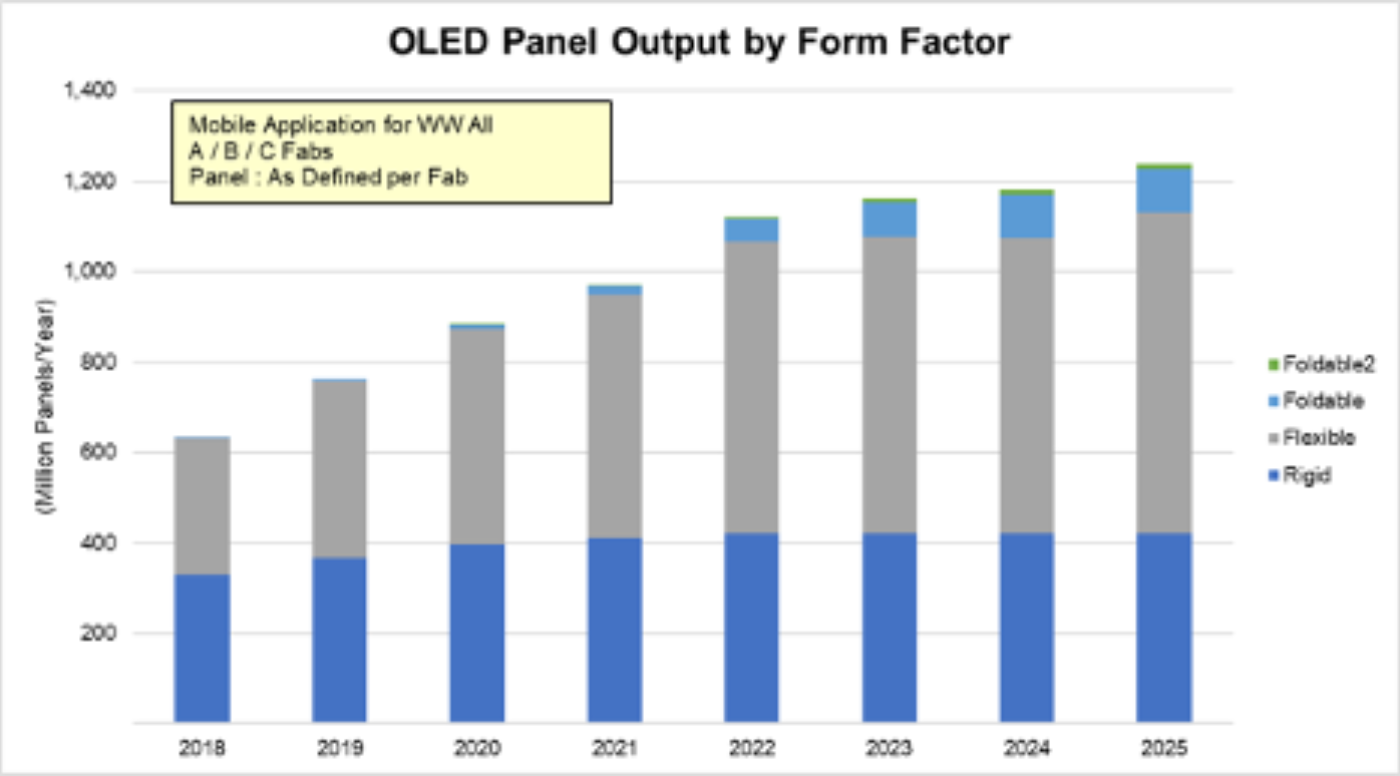
Of course, while input area is important, especially for materials suppliers, the supply/demand outlook is shaped by the product mix and yield, and the report works through the details of fab ramps, yield curves, and product mix to estimate the total industry output as shown in the figure below. In this update, we segregate Foldable products into two groups, with the Foldable2 group representing larger foldable products such as notebooks and tablets, while Foldable represents smartphones. Our report reflects the reality in the industry that yields on OLED smartphone products are lower than expected for all panel makers except Samsung Display.
OLED Smartphone Panel Output (Supply Capacity in Units) by Form Factor
On the TV side, we have again revised our capacity outlook down compared to our Q1 forecast, based on the slower ramp of LGD’s Guangzhou fab, and adjustments for the capacity outlook for SDC, BOE, and CSOT. The result is that OLED capacity for TV and Other applications is expected to rise at a 32% CAGR from 2019 to 2025, from 4.9 million square meters in 2019 to 26.2 million square meters in 2025.
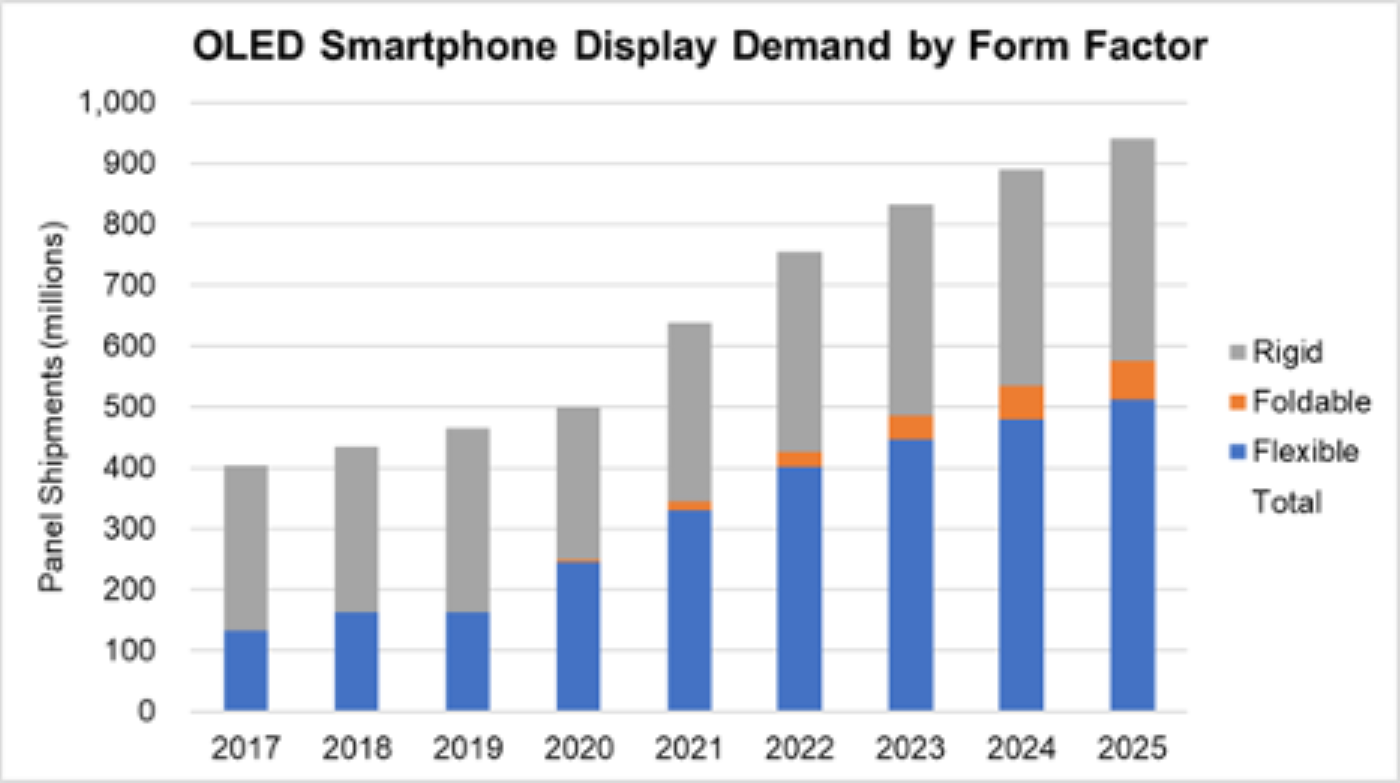
Now shifting to the demand side, the next chart gives DSCC’s outlook for OLED smartphone panel demand from 2017-2025 by form factor in units. We forecast OLED smartphone panels to increase from 466 million in 2019 to 941 million in 2025, with foldable smartphone displays increasing from zero to 62 million.
OLED Smartphone Panel Demand by Form Factor, 2017 – 2025
The DSCC demand forecast includes eleven different applications, and the details are available in DSCC’s Quarterly OLED Shipment Report?. The OLED Supply/Demand report includes a summary of our forecast by application. In unit terms, after smartphones the largest application is the smart watch, expected to increase from 28 million in 2017 to 152 million in 2025. Of course, smart watch demand does little to fill area capacity, but it brings in nice revenues, expected exceed $2 billion in 2020.
With respect to TV panel demand, we expect it to increase from 3.4 million units in 2019 to 14.5 million units in 2025. This forecast based on continuing intense competition from LCD, which combined with the COVID-19 disruption has slowed down LGD’s aspirations for OLED TV. With LCD panel prices near their all-time lows, the gap between LCD and OLED panels remains wide at nearly 5x for 55” and 65” panels. With such a wide price gap, LGD is unable to sustain both high prices and high volumes, and will need to carefully manage its expansion to avoid oversupply and the need to drop prices precipitously.
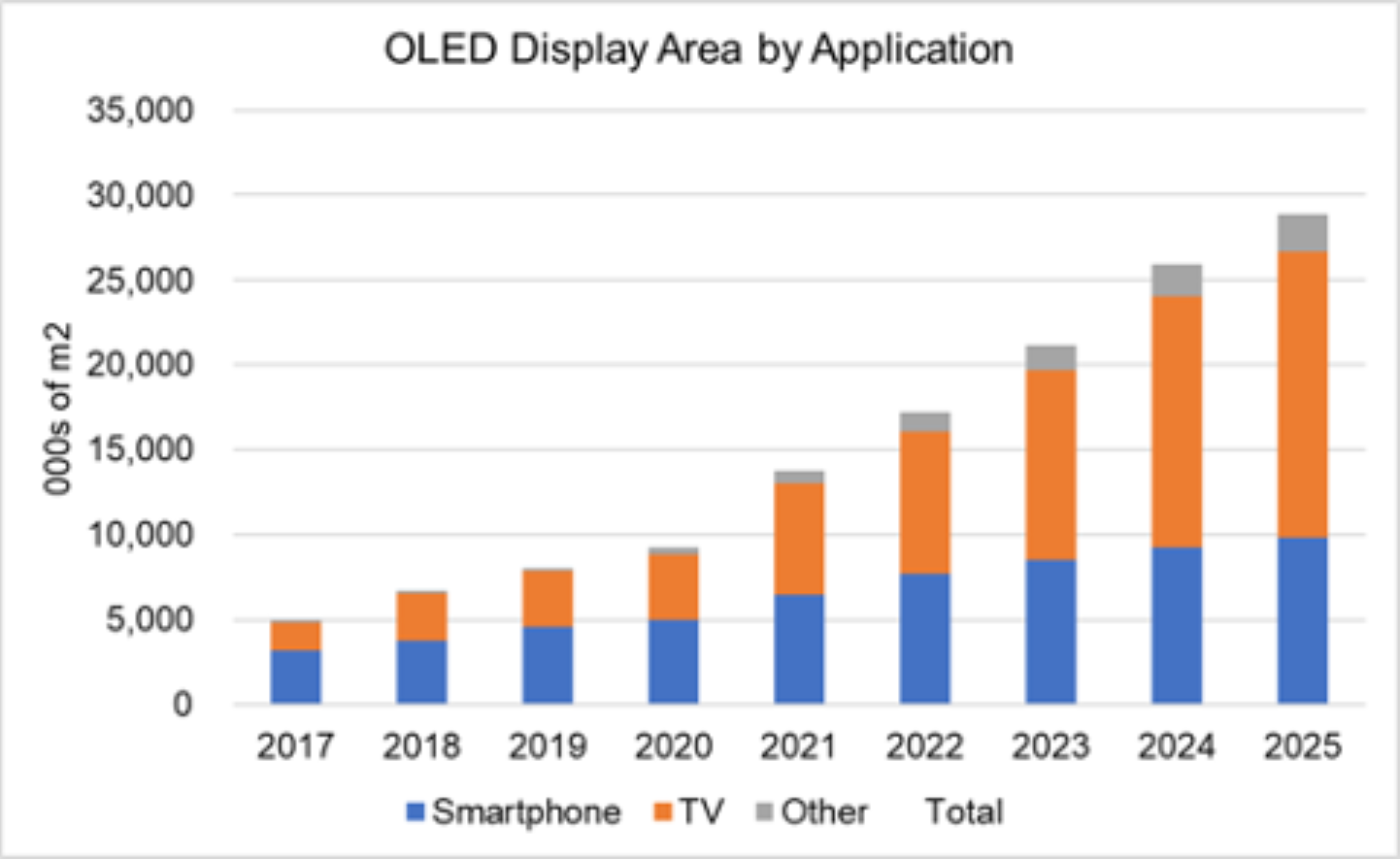
In working out the total supply/demand balance, we need to work in area terms, and our forecast for OLED display panel area by application is shown in the next chart. While smartphone represented the largest display area in 2019, we expect TV to surpass smartphone in 2021 and eventually grow to 58% of all area demand by 2025, while the area demand for “all other” applications climbs to 8% of the total, driven by IT applications (monitors, notebooks, and tablets), and smartphones fall to 34% of OLED area demand.
OLED Panel Demand by Application, 2017 – 2025
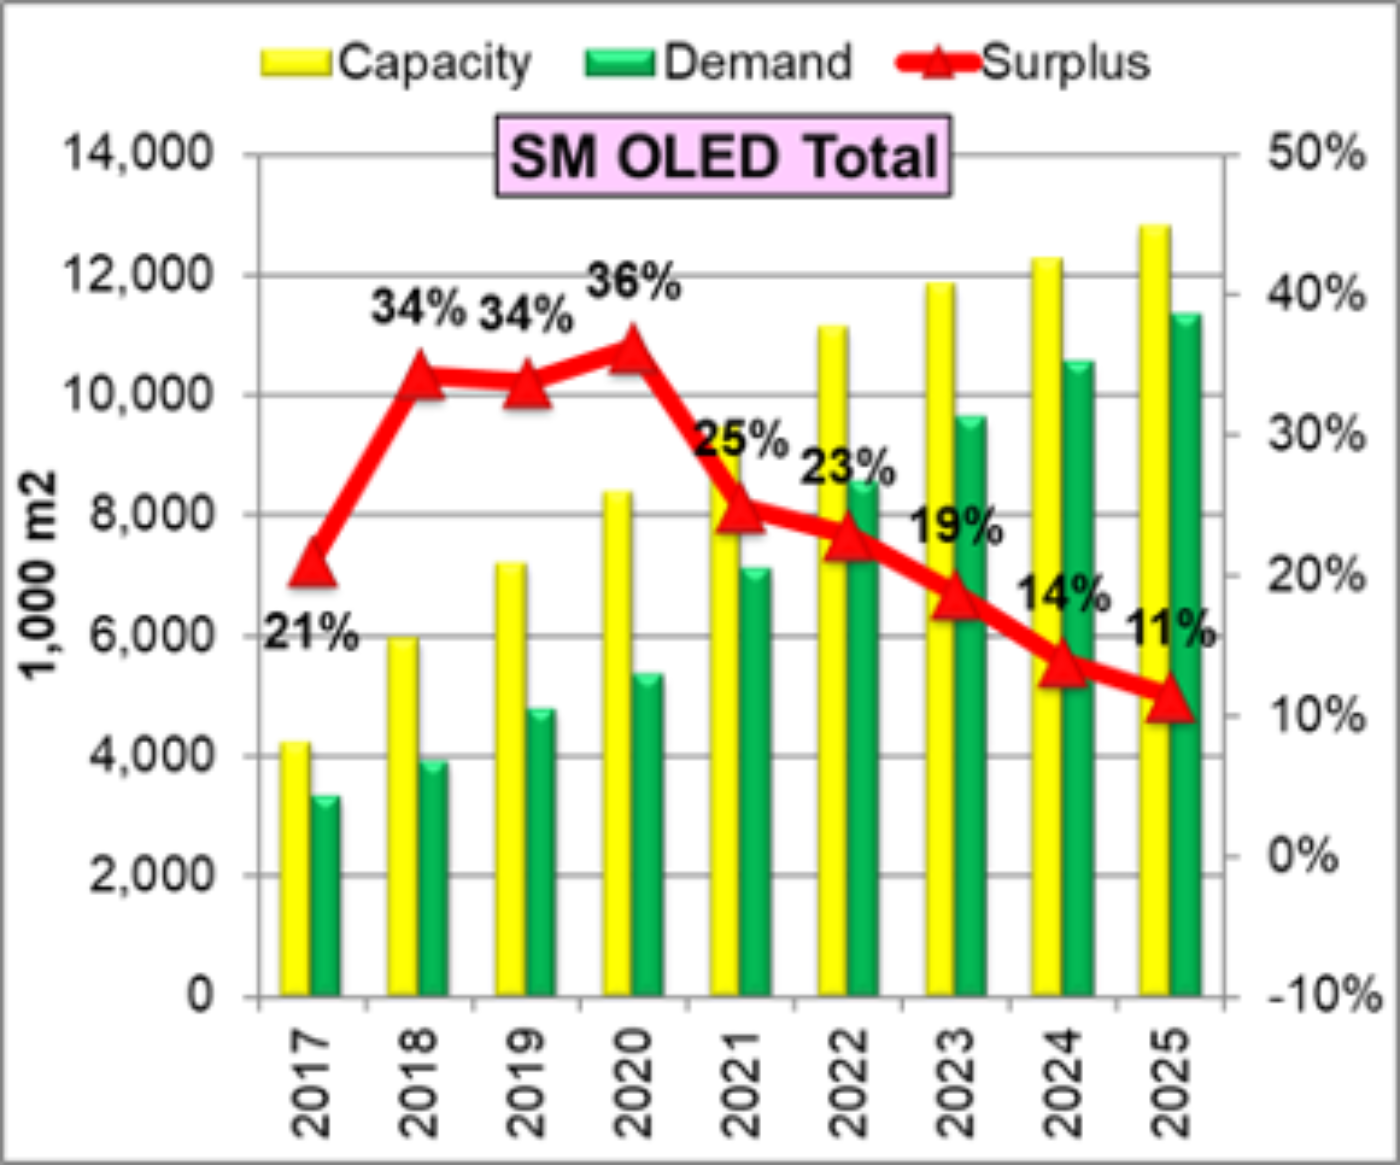
Now putting that together into supply/demand picture, the final chart shows our outlook for smartphones for OLED panels, combining Rigid OLED and Flexible OLED. We expect OLED smartphone overcapacity to continue out to 2025, but the magnitude of the oversupply to diminish from 36% this year to 11% in 2025. The picture for rigid OLED is better, and that for flexible is worse, but the dividing line between rigid and flexible will become blurry, as we expect BOE and perhaps other panel makers to make rigid panels for notebook PC on flexible lines starting in 2022-2023.
OLED Supply/Demand for Smartphone Panels
On the TV side, we expect that LGD’s overall OLED TV fab utilization in 2020 will fall to 80%, compared to persistent 90%+ capacity in the last few years. We expect UT% will increase in 2021 and OLED TV will be capacity limited for the rest of our long-term forecast. LGD will work to balance capacity growth with price erosion.
The DSCC Quarterly OLED Supply/Demand and Capital Spending Report gives a comprehensive perspective on the OLED industry. For more information about the report, please contact Gerry McGinley at 770-503-6318, e-mail [email protected], or contact your regional DSCC office in China, Japan or Korea.