Advanced TV revenues are forecast to grow by a 5% growth rate from 2019 to 2025 to $22 billion, according the new DSCC Quarterly Advanced TV Shipment and Forecast Report, now available to subscribers. This report covers the worldwide premium TV market, including the most advanced TV technologies: WOLED, QD Display, QDEF, Dual Cell LCD and MiniLED with 4K and 8K resolution. This quarter’s update adds MicroLED to our forecast, as well as rollable OLED TVs.
The report looks at current and future TV shipments and revenues by technology, region, brand, resolution and size, and forecasts the growth of all of these technologies. The report includes the preliminary shipment result for Q2 2020, a forecast by quarter for 2020 and an annual forecast to 2025.
We define an Advanced TV as any TV with an advanced display technology feature, including all OLED TVs, 8K LCD TVs and all LCD TVs with quantum dot technology. The historical data in the report allows analysis by feature for advanced LCD TVs, including:
- QDEF TV: TV using a Quantum Dot Enhancement Film; these TVs are sold as “QLED” by Samsung, TCL, and others.
- MiniLED: LCD TVs with a MiniLED backlight, as sold by TCL starting in 2019.
- Dual Cell: LCD TVs employing dual-cell technology, as introduced by Hisense in 2019.
- LCD Others: this category includes LCD TVs with 8K resolution, that do not fall in any other category.
The historical data for OLED TV includes only one product configuration, LGD’s White-OLED (WOLED) technology, but the forecast in the report includes QD Display, which designates QD OLED and successor technologies such as QNED and EL-QLED, as well as Rollable OLED and MicroLED starting this quarter. Our forecast for MicroLED TV is based on product sizes less than 100”, as products in larger sizes such as Samsung’s 146” The Wall belong in a different category than “TV”.
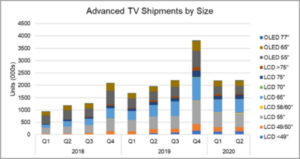
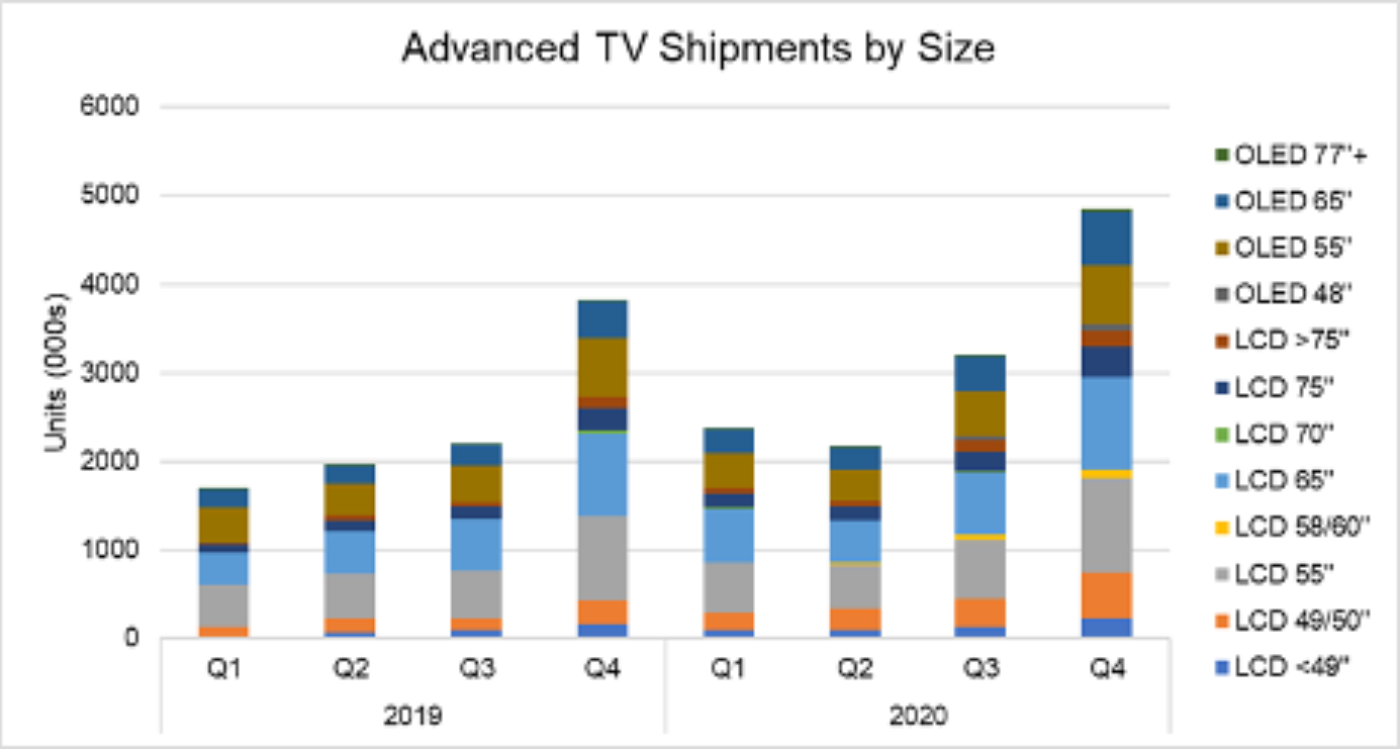
Advanced TV shipments in Q2 2020 were flat Q/Q and increased by 12% Y/Y at 2.2 million units, as shown in the first chart here. The largest screen sizes recorded bigger gains, with 75” Advanced LCD TVs up 29% and 77” OLED TVs up 100% compared to a year ago. Smaller QDEF TVs (under 49”) were introduced in 2019 and these size are growing rapidly from a low base in terms of unit shipments, with 111% growth Y/Y in Q2.
Advanced TV Shipments by Size and Display Technology, Q1 2018 to Q2 2020
From a revenue perspective, Q2 disappointed with revenues declining 20% Y/Y as price declines overwhelmed volume increases. Even the largest TVs showed revenue declines, with 75” LCD down 12% and >75” LCD TV down 15%. Advanced LCD TV revenues for 55” declined by 14% Y/Y, and 55” OLED TV revenues declined by 38% Y/Y in Q1. Across all screen sizes and resolutions, OLED TV revenues declined by 29% Y/Y in Q1, while Advanced LCD TV revenues decreased by 15%.
The report’s pivot tables allow analysis of brand share by screen size, region, technology, resolution and other variables. In Q2 2020, among all Advanced TV products Samsung increased unit shipments by 52% Y/Y, increasing its unit share to 61% by expanding its QDEF product line into more affordable models. TCL and Hisense Advanced LCD TV shipments declined Y/Y. In OLED TV, the top three global brands (LG, Sony, and Panasonic) increased shipments Y/Y, but smaller players TPV/Philips and Skyworth saw shipments decline Y/Y.
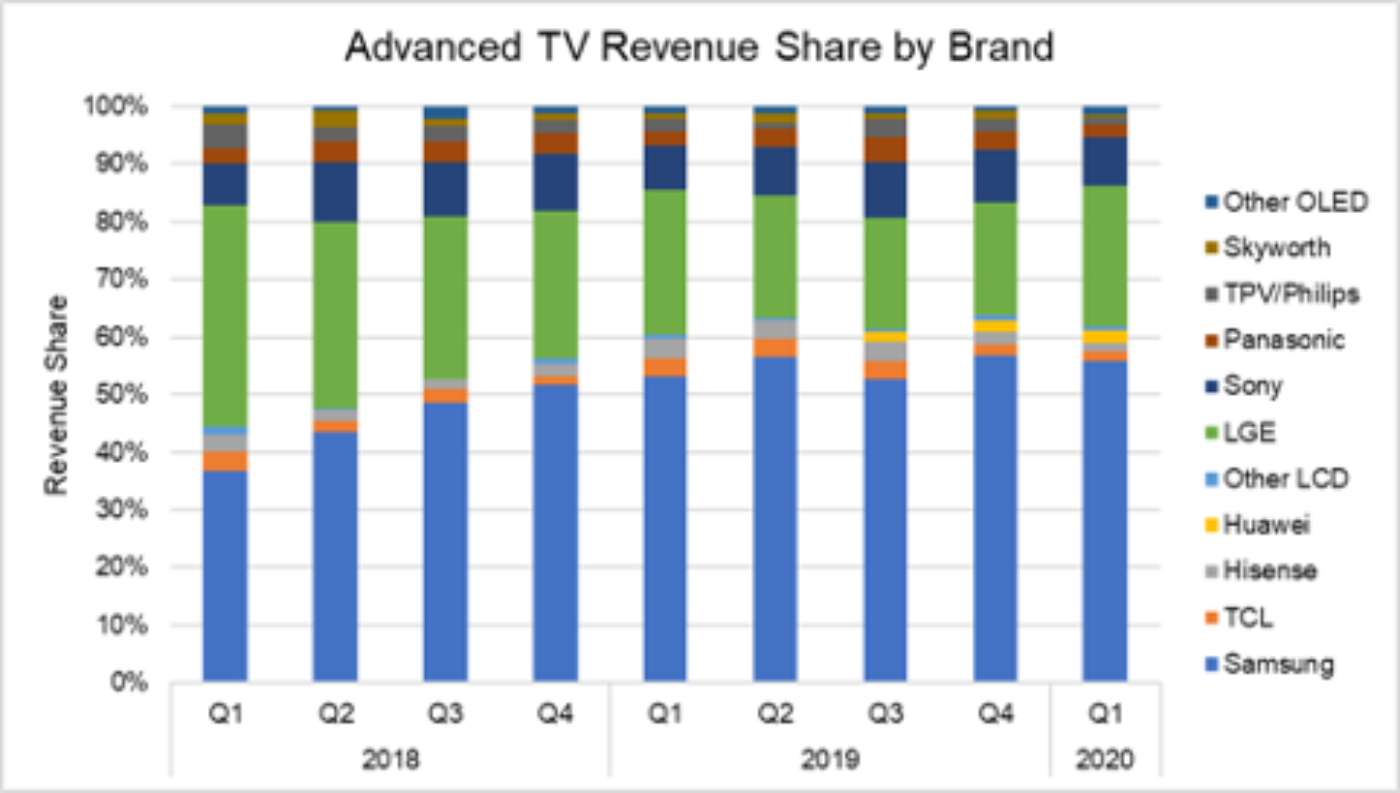
Samsung also leads the industry in revenue share for Advanced TV, as shown in the next chart here, but Samsung’s revenue share of 54% in Q1 is lower than its unit share, since QDEF sells at a discount to OLED TV in the screen sizes where they compete. LG has sustained the #2 position in revenue share, and regained 5 share points in Q1 after some share erosion during 2019. LG’s revenue share in Q1 of 24% was a slight decrease from their 25% share in Q1 2019. Sony sustained the #3 position in brand revenue with 8% share, consistent with its share a year ago, but down from a 9% share in Q4 2019.
Advanced TV Revenue Share by Brand, Q1 2018 to Q1 2020
The report divides worldwide shipments into eight geographic regions, and up to now Western Europe and North America have been the largest regions for Advanced TV. These two regions represented a combined 64% and 65% of Advanced TV units and revenue in Q1 2020. Shipments to Western Europe increased 38% Y/Y in Q1 2020, but revenues increased only 2% Y/Y. Shipments to North America increased 66% Y/Y and revenues increased 21% Y/Y, while China shipments increased by 21% Y/Y but revenues declined by 9%.
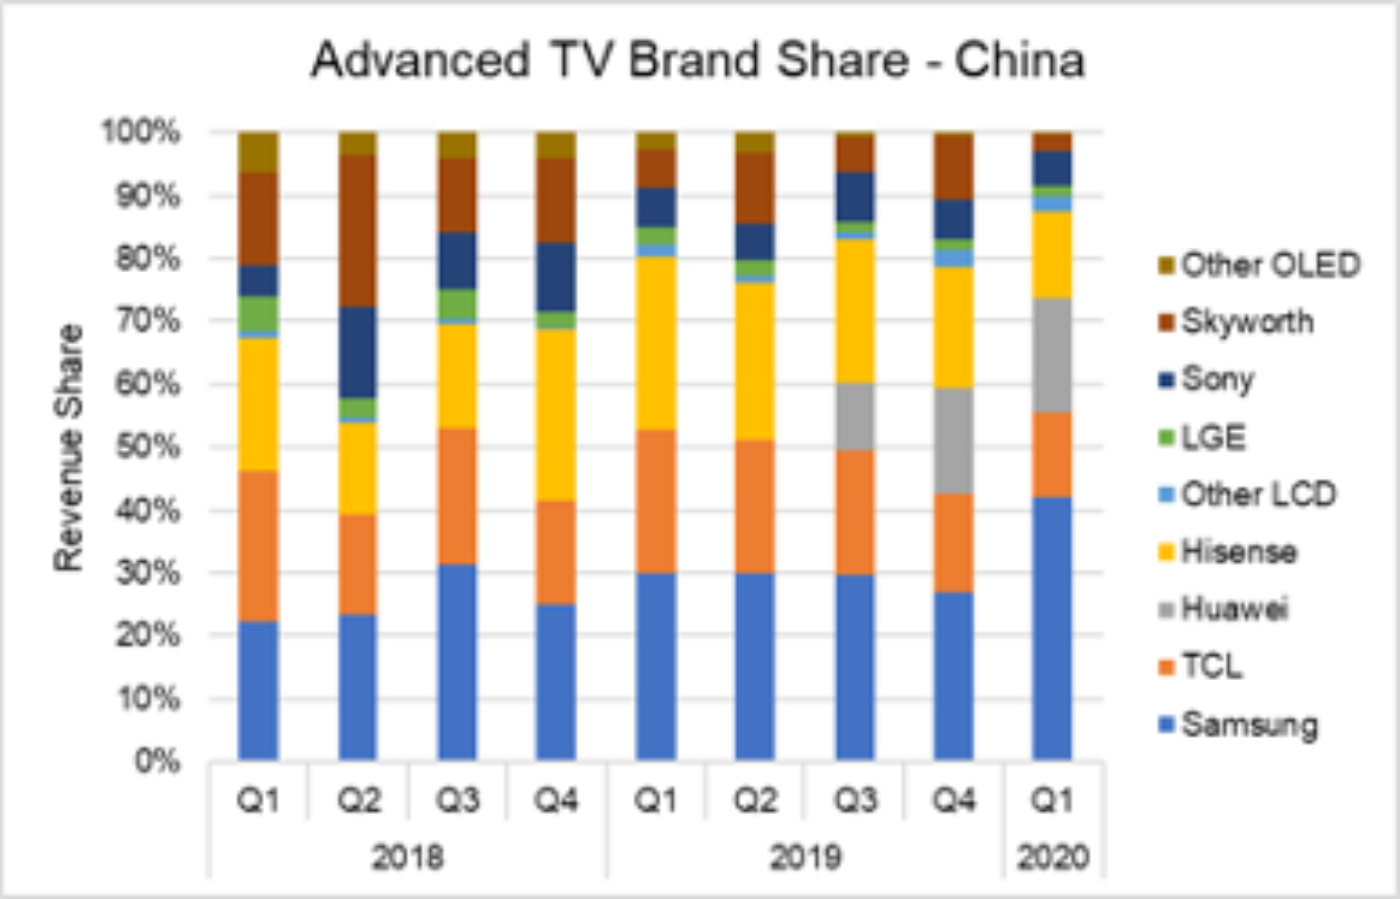
The Powerpoint report includes analysis of brand share by region and product segment, allowing a more focused view of brand share battles. The share battle in China has gotten increasingly intense, as shown by the next chart here. China has become a true battleground with four companies with double-digit % market share. Samsung share of Advanced TV increased to an all-time high in Q1 with 42% unit and revenue share, and Huawei has emerged as a major player with Advanced LCD TVs, capturing 18% share in Q1. Hisense introduced OLED TV in 2019, but this did not prevent the company’s share from eroding to 14% in Q1. LGE fares poorly in China with less than 5% share. Skyworth, once a major player with 24% share in Q2 2018, has seen its position diminish to only 3% share in Q1 2020.
Advanced TV Revenue Share in China by Brand, Q1 2018 to Q1 2020
In North America, Samsung enjoys a dominant position on the strength of its large-screen product portfolio. Samsung continued to lead in Q1 2020 with 63% unit share and slightly lower revenue share of Advanced TV. LG has sustained its #2 position in both units and revenue and regained some share in Q1 2020 after steadily losing share throughout 2019. Vizio emerged as a major player in the market with affordable QDEF TVs; Vizio’s revenue share is much lower than its unit share but it has established its position as a clear #3 brand in Advanced TV. Sony’s revenue share is higher than its unit share, but is still only 5%.
In Western Europe, Samsung continued to lead in Q1 2020 with 63% unit share but this has fallen from a peak of 68% in Q1 2019. Samsung’s revenue share in this region is only 52% as OLED TV sells at premium prices in Europe, and Samsung’s advantage in larger sizes means less to European consumers. LGE regained unit share to 21% in Q1 2020, and took 27% revenue share with premium OLED TV prices. Sony has been able to sustain a double-digit revenue share in Europe with an attractive OLED TV product line, but Panasonic and Philips have seen their positions erode to low-single digits.
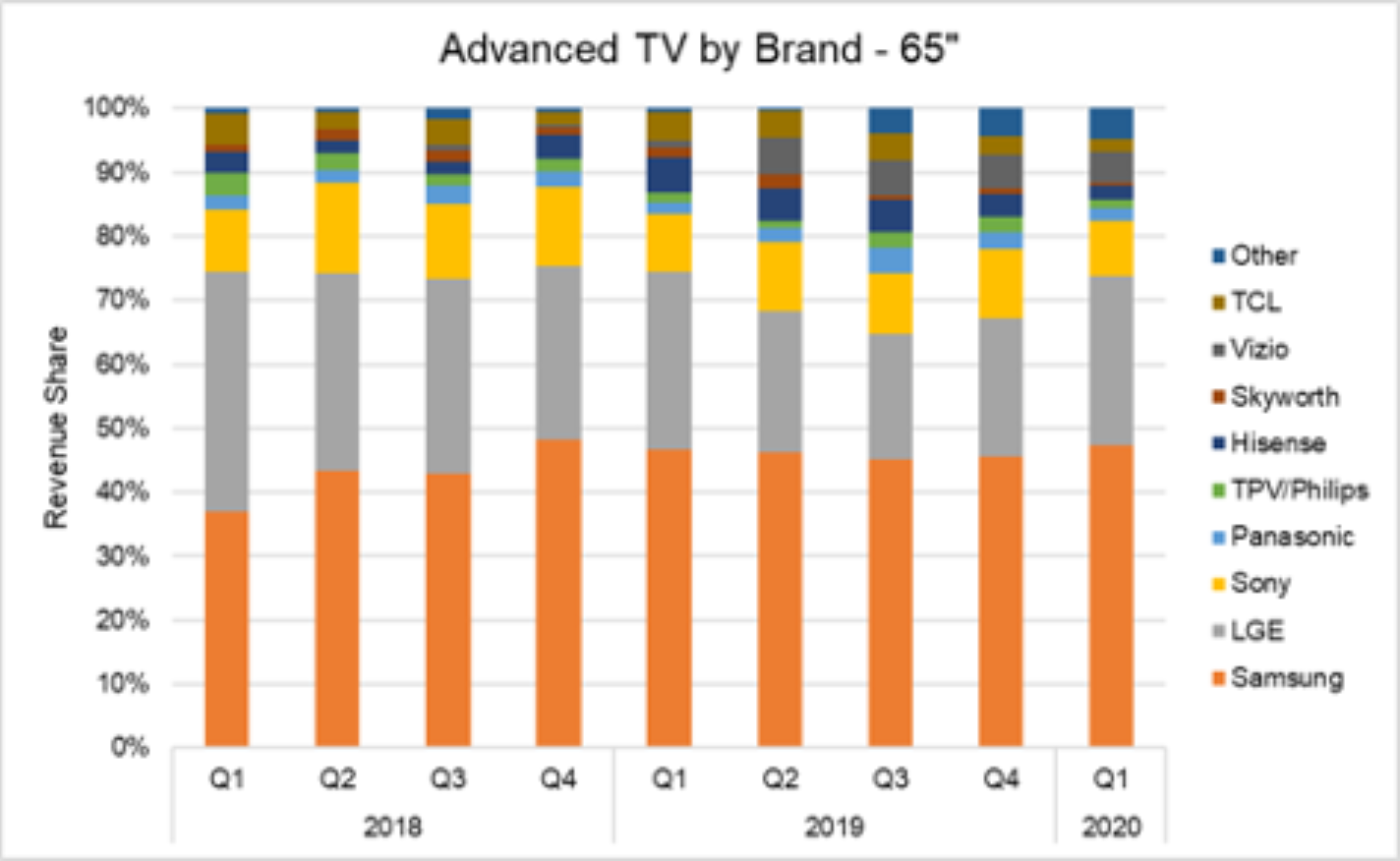
Another interesting cut of the brand data is the battle by screen size, with the 65” battle shown in the next chart. Samsung continues to lead this size category in Q1 2020 with more than 50% unit share, but Samsung’s revenue share in 65” is lower than unit share, as QLED sells at a discount to OLED. LG regained some share in Q1 2020 after steadily losing share throughout 2019, sustaining its #2 position with 27% share of revenues in this size. Sony’s share has deteriorated with slower growth than the market. Vizio has emerged with a 6% global market share in units in 65” even though selling only in North America, but Vizio’s revenue share is less than 5% since they sell at lower prices.
Worldwide Advanced TV Revenue Share for 65” by Brand, Q1 2018 to Q1 2020
The battle for larger sizes is no battle at all, as in 70”+ Samsung captures more than 75% of both units and revenue. Samsung saw its position slip a bit in Q1 2020, though, as LGE and Sony sales of 77” OLED increased dramatically, bringing their revenue shares to 10% and 7%, respectively, and reducing Samsung’s revenue share to 77%.
The report allows detailed analysis of historical shipment patterns, but also provides DSCC’s forecast of technology, product, and pricing. The next chart shown here shows DSCC’s quarterly forecast for 2020 by screen size and display technology. While the COVID-19 impact will slow growth in Q2 to 11% Y/Y, growth will resume in the second half of 2020 and Q4 unit growth will reach 27% Y/Y. OLED 48” will start in limited volumes, adding to the product mix for OLED, and LGD’s increasing OLED capacity will allow OLED to hold its unit share of Advanced TV, and increase OLED’s revenue share. Across all technologies and sizes, we expect Advanced TV unit shipments to increase by 30% in 2020 compared to 2019.
Advanced TV Shipments by Size and Display Technology, 2019-2020
OLED TV revenues are expected to increase for the full year over 2019, with 11% revenue growth in Q4 on higher volumes and modest price declines. Advanced LCD TV revenues, though, are expected to be flat, with 1% growth for the full year 2020 and a 2% decline in Q4 2020 compared to Q4 2019, as aggressive pricing overcomes volume gains.
Turning to the long-term forecast, we expect that Advanced TV shipments will grow from less than 10 million in 2019 to nearly 35 million in 2025, a 24% CAGR for that time period. OLED TV units are expected to grow at a 31% CAGR from 2019-2025 to 14.7 million units, while Advanced LCD TV units are expected to grow at a 21% CAGR to 20.8 million units. The largest sizes will see the biggest growth, with growth in 75”+ expected to be 36%, and growth in 75”+ OLED even higher at 87% CAGR.
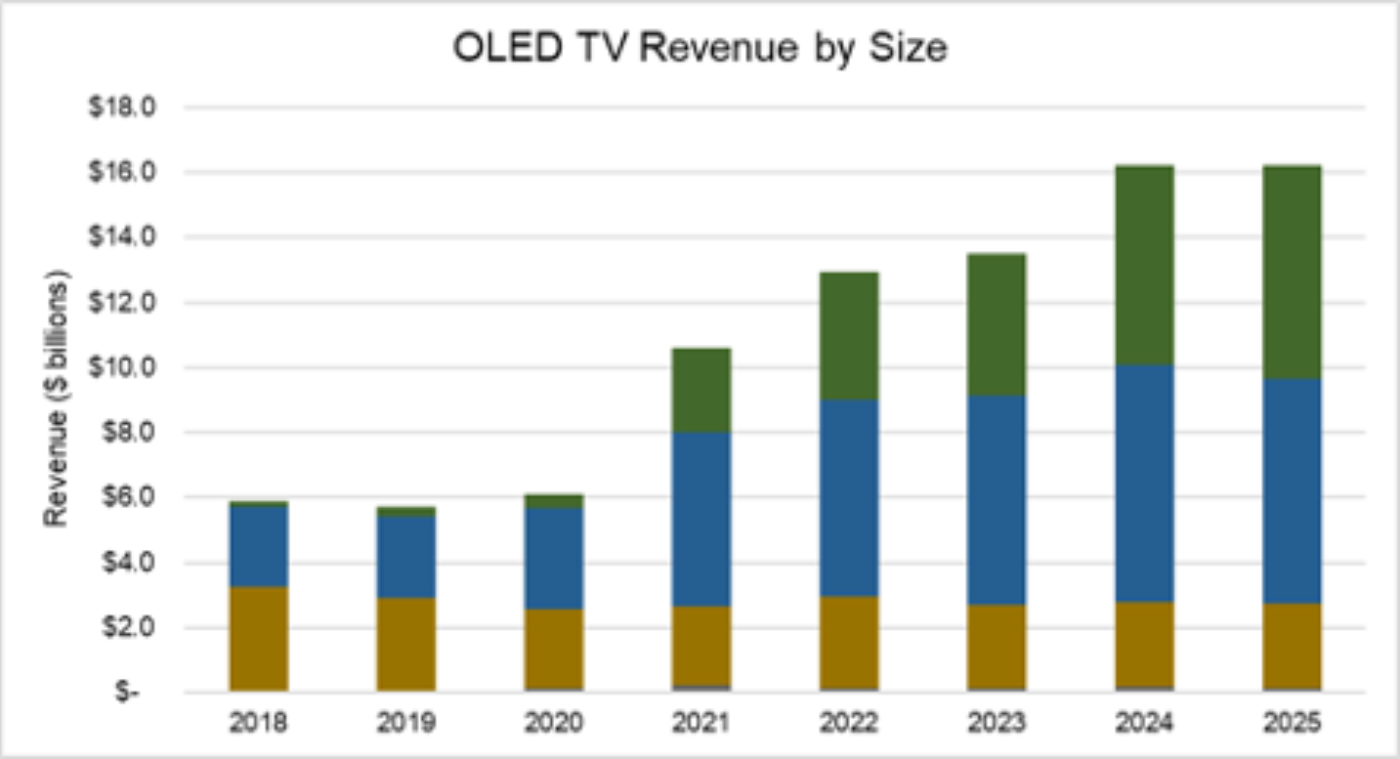
From a revenue standpoint, while the overall category will see revenue growth, OLED TV is expected to capture all the revenue growth in Advanced TV, as Advanced LCD revenues are expected to be the same in 2025 compared to 2019. OLED TV revenues are expected to grow at a 19% CAGR from 2019-2025 to $16.2 billion. Advanced LCD TV revenues were $10.0 billion in 2019, are expected to peak at $11.1 billion in 2022-2023, then decline to $10.0 billion by 2025. Even larger size LCD TVs are not expected to have revenue growth as Samsung shifts its emphasis from its “QLED” LCD products to QD OLED.
OLED TV revenue growth is expected to be dominated by 75”+ as these products become more affordable with MMG by LGE and Samsung. We expect Samsung’s QD OLED product portfolio to have larger average screen sizes than LG’s White OLED, because of Samsung’s push to larger screens in LCD. Further, we expect Samsung’s QD OLED products will be exclusively 8K resolution, which gives another reason for larger average screen sizes. High prices and large screen sizes will allow QD Display to grow to nearly $7 billion in revenues in 2025, capturing 25% of Advanced TV revenues.
OLED TV Revenue Forecast by Screen Size, 2018 – 2025
Our last chart in this article shows our forecast for 8K TV by display technology. While 8K will be dominated by LCD TV technologies in its early stages, when Samsung introduces QD OLED we expect that this technology will quickly dominate the revenue share for 8K TV and by 2023 will take nearly 50% unit share. We do not expect White OLED to be affordable in 8K, so we expect only very small volumes of this technology, but we expect LCD technologies to continue to show growth in 8K products.
8K TV Shipment Forecast by Display Technology, 2018 – 2025
DSCC’s Quarterly Advanced TV Shipment and Forecast Report includes technical descriptions of all major advanced TV display technologies, plus quarterly shipment results from Q1 2018 through Q1 2020 preliminary results, sortable by technology, region, brand, resolution and size, and includes pivot tables for analysis of units, revenues, ASPs, and other metrics. The report includes DSCC’s quarterly forecast for the current year plus an annual forecast for five years across technology, region, resolution and size. Readers interested in subscribing to the DSCC Advanced TV Shipment Report should contact [email protected].